Outlook Gantt Charts
With Gantt Charts in Outlook, project managers and executives never have to leave their email to review the status and progress of their projects.

Gantt Charts in Outlook
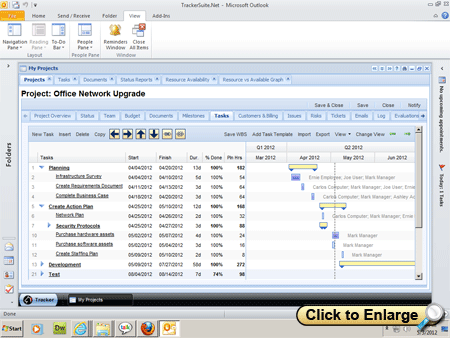
TrackerSuite.Net is a 100% Web based solution that can be surfaced in Microsoft Outlook. It provides dynamic Gantt Charts that make it easy to review task progress and make schedule changes. Using these views, users can:
- Change task start/end dates within the view with in-line editing, or by dragging the workload bars.
- Easily rearrange task order, establish sub-tasks and dependencies.
- Configure the view the suit their needs by adding/removing columns or rearranging them with drag-and-drop.
As well as surfacing TrackerSuite.Net within Outlook for these Gantt Chart views, users can enjoy other integration features, including the ability to create documents, support tickets and tasks by dragging and dropping Outlook emails.

TrackerSuite.Net does not require Microsoft Exchange. It may hosted in your organization's private Cloud, or delivered as a service from Automation Centre.

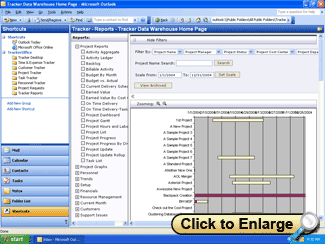
As well as the Outlook Gantt Chart, the Tracker Data Warehouse provides an array of graphical business intelligence reports including time pies as well as line-reports such as overdue projects.

